Churn Prediction Models for B2B SaaS Using Product Behavior
Feature adoption depth and workflow completion predict churn better than login counts alone.
B2B SaaS churn averaged around 12.5% annually in 2025, which means a $30M ARR business bled $3.75M before anyone even counted the contraction on accounts that stuck around. The companies that beat that number by any real margin share one habit: they built prediction models on what customers actually do inside the product rather than on what customers say during a call or when a contract happens to expire. Most teams still get this backwards. They lean on login counts and renewal-date guesswork instead of the behavioral data already sitting in their own database, and that choice is the single biggest reason their churn models underperform. This piece lays out which signals carry real predictive weight, how to weight them inside a working model, and how to turn a probability score into an intervention that actually changes the outcome.
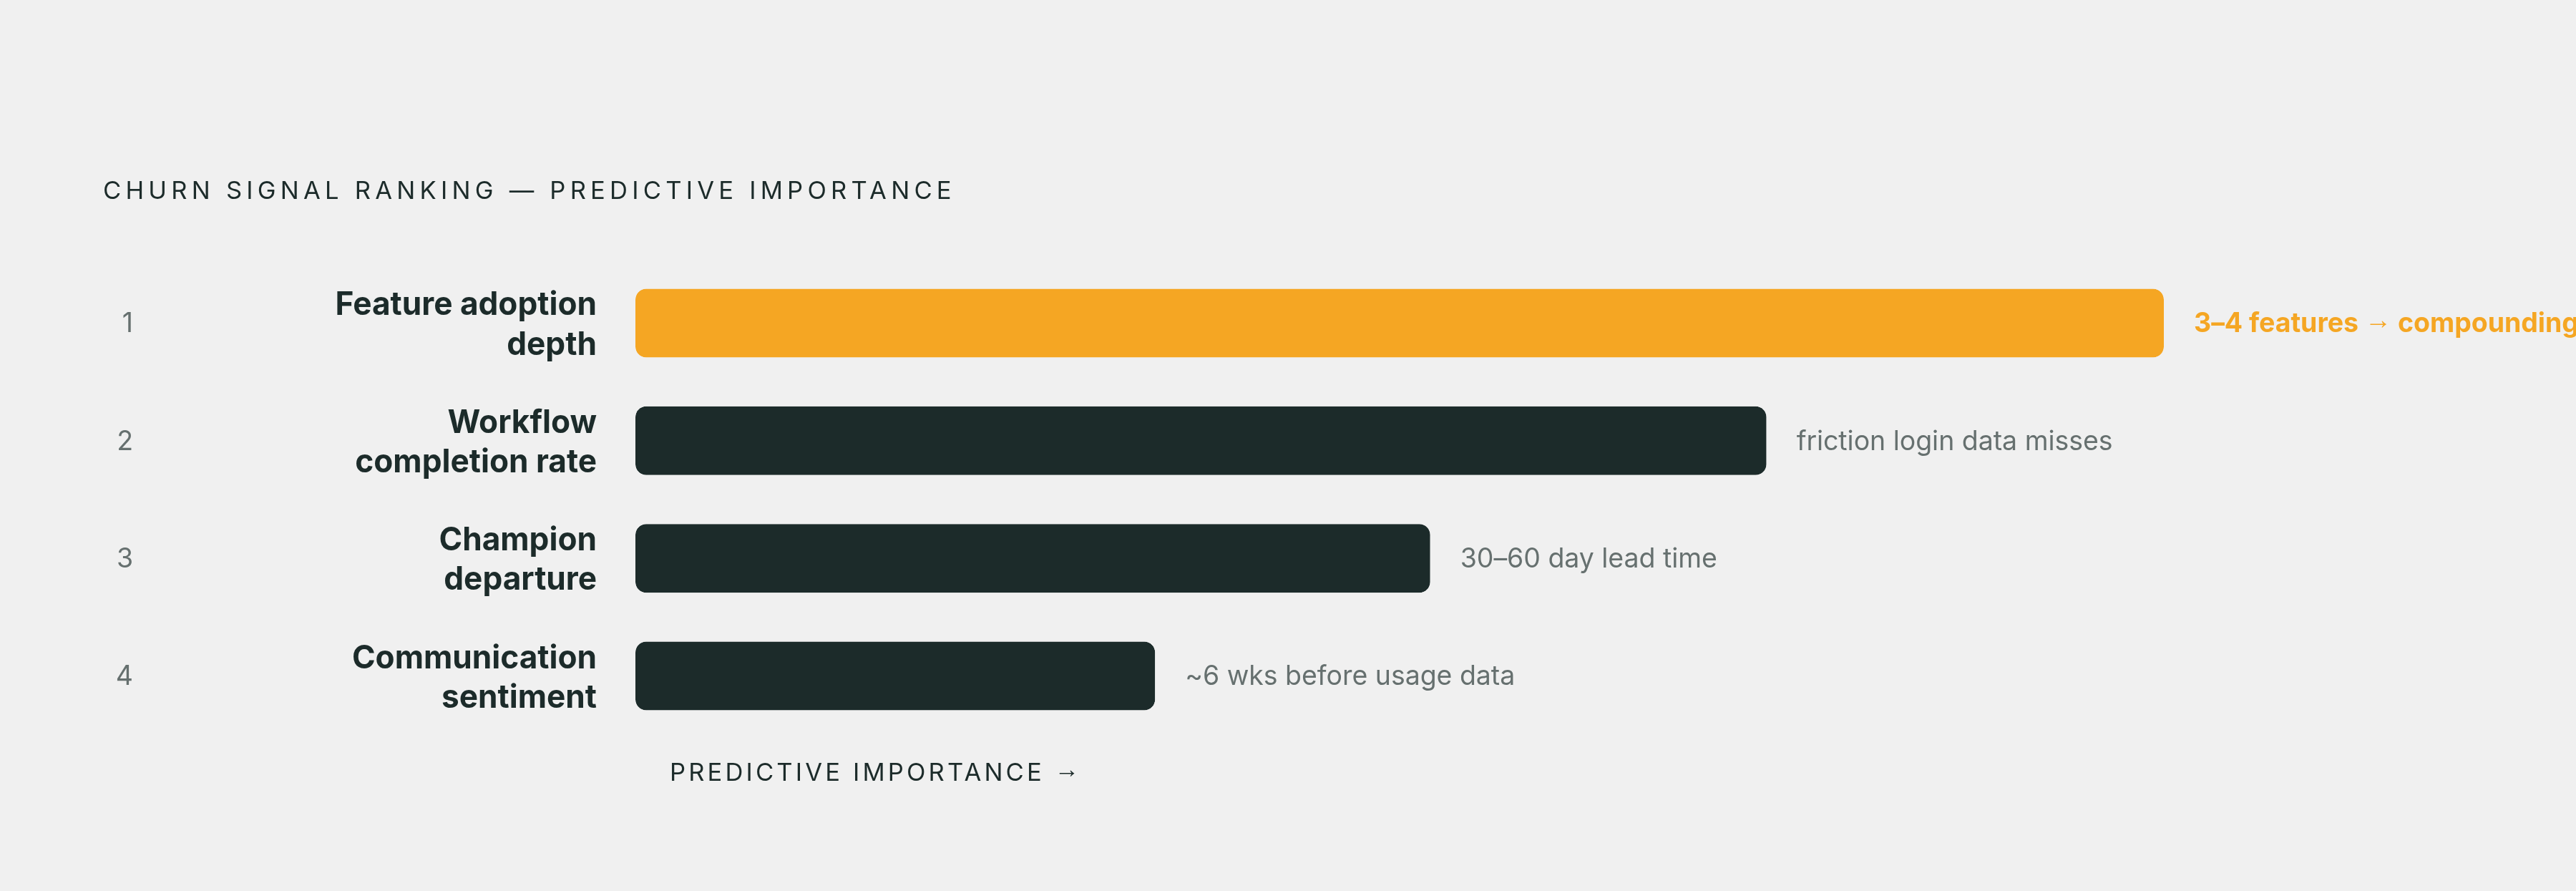
For a B2B SaaS company at roughly $30M ARR carrying 12.5% annual churn, the signals that carry the most predictive weight are feature adoption depth, workflow completion rates, champion departure, and communication sentiment, in that order of priority. Feature adoption depth leads because a customer running three or four features through daily operations has switching costs that a single-feature user simply does not, and the model should reflect that gap explicitly rather than averaging it away. Workflow completion rates catch friction that login data misses entirely, and champion departure typically precedes churn by 30 to 60 days, wide enough to act inside if the signal is caught early. Weighting should apply four principles across all signals: recency, so that a usage drop in the last two weeks outweighs one from three months ago; velocity, so that a declining trend over six weeks ranks above any single bad data point; breadth, counting distinct features actually touched rather than login events; and depth, measuring whether workflows are completed rather than merely opened. Multi-signal deterioration, where adoption breadth, workflow completion, and relationship signals degrade at the same time, predicts churn far more reliably than any single indicator moving alone, and the composite health score should surface those accounts first.
What the churn benchmarks reveal about where risk actually hides
Strong performance in B2B SaaS now means annual churn below 5%, with the top enterprise teams holding under 3%. SMB SaaS typically runs 5-7% annual churn, while mid-market lands somewhere in an 11-22% range, and a team benchmarking itself against the wrong tier will either celebrate mediocrity or panic over a number that's fine for its segment.
A 2025 McKinsey analysis of 55 B2B tech SaaS companies found top-quartile performers reached net revenue retention of 113%, against 98% for the bottom quartile. That 15-point gap has little to do with pricing strategy or product category and everything to do with retention discipline. Mid-market teams sitting in the 11-22% band with no behavioral prediction framework in place aren't just losing customers each quarter; they're spending fresh acquisition dollars to replace the very accounts they could have kept, which is the most expensive way to run a growth motion. Waiting to build a behavioral model carries a real cost, and that cost compounds every quarter it's deferred.
Which behavioral signals carry the most predictive weight in a churn model for B2B SaaS?
Login frequency gets tracked more than any other churn signal, mostly because it's cheap to measure and easy to trend on a dashboard. That popularity is a mistake, since absence of login activity isn't proof of dissatisfaction, and treating it that way manufactures false positives. A user who logs in twice a month but finishes every workflow they touch carries a different risk profile than a daily visitor who never completes what they start. Login data has to get read alongside depth; a model that leans on login counts alone is measuring the wrong thing well.
Feature adoption depth is where the real signal lives, and it's the one most teams underweight. Users who adopt multiple features demonstrate meaningfully stronger retention than single-feature users, with switching costs that compound as each additional workflow becomes part of daily operations. The mechanism isn't mysterious: a customer running one workflow through the platform is one competitor's feature parity away from leaving. A customer with three or four features woven into daily operations has switching costs a slicker landing page can't undo.
Workflow completion rates catch something login and adoption metrics miss: friction. A user who starts a workflow and abandons it partway through is telling the product team something specific, usually that the tool doesn't map cleanly onto their actual job. That's a different problem than a user who never opens the workflow at all, and it needs a different fix. Conflating the two, treating "started but stuck" the same as "never engaged," is one of the more common ways teams misread their own data.
Time-to-value after onboarding deserves its own line item. Healthy product-led growth products show strong early activation, and teams that miss a fast time-to-value window consistently see elevated churn risk in the months that follow. Teams missing that window aren't just off to a slow start; they're manufacturing churn risk before the customer has reached a first renewal date.
Support ticket volume trips up a lot of naive models because it moves in a U-curve, not a straight line. Zero tickets sounds like a satisfied customer, but it often means the opposite: a user with no support contact may be too disengaged to even hit friction worth reporting. Very high ticket volume signals distress in the more obvious direction. The safest zone sits in the middle, where a customer is engaged enough to run into problems and invested enough to ask for help solving them. A rule built purely on "flag high ticket volume" misses the quietly checked-out accounts entirely, and that's exactly the group most worth catching.
Champion departure might be the most underused signal in the category. When the person who championed the purchase changes roles or leaves, whoever inherits the account inherits a contract they never chose, and that's a structurally weaker relationship from day one. Champion departure typically precedes churn by 30 to 60 days, wide enough to act inside if the signal gets caught early. Communication sentiment, pulled from emails, calls, and support tickets, can surface relationship deterioration roughly six weeks earlier than product usage data alone would show it. Most customer success teams still find out about a champion leaving at the renewal call itself, which is the single latest possible moment to learn it, and by then the account has usually already decided.
How churn prediction models are built around behavioral features
Modern churn prediction models run on 50 to 200-plus features. The behavioral signals above are inputs into that feature set; the model architecture decides how much predictive value actually gets pulled out of them.
Rule-based systems, "no login in 30 days, flag the account," are the simplest starting point and the easiest to explain to a room full of stakeholders. They're also blind to compound signals: they can't catch the account where login frequency is stable but workflow completion has quietly cratered over six weeks. Teams that stop at rule-based scoring are choosing explainability over accuracy, and in a mid-market book of business, that trade rarely pays off. Anyone still running churn triage on a spreadsheet of login dates is leaving the most predictive data on the table.
Gradient boosting, XGBoost in particular, is the practical entry point for most B2B SaaS teams. It handles moderate data volumes well, produces strong accuracy, and stays interpretable enough that a data team can explain a given prediction to a VP of Customer Success without a statistics lecture. A 2025 peer-reviewed study from Emerald found decision trees came out as the top-performing algorithm for one particular SaaS dataset, a useful reminder that the "best" algorithm depends on the shape of a company's own data, not on whichever model happens to be trending in the literature. Random forest and survival analysis methods earn their place when timing matters as much as probability, since survival models are built specifically to estimate when an event happens, not just whether it will.
Regardless of model choice, the output is usually a churn probability score, often scaled 0 to 100, that customer success teams use to triage which accounts get attention first.
One architectural decision matters more than model choice: account-level versus user-level prediction, and most teams default to the wrong one. Account-level models aggregate every user in a customer organization into a single health score, which sounds efficient and actually hides the real problem. A twelve-seat account can have one power user logging in daily while eight colleagues have gone completely dark, and an account-level average smooths that disparity into something that looks fine on paper. User-level models catch the divergence that account-level averages erase. The more mature approach runs both and reconciles them: an account health score explicitly informed by the variance across individual users, not just their mean.
On accuracy: 70% is the floor before a model should touch real intervention decisions, not a target to be proud of. The strongest B2B SaaS teams push that to 80-90%, the range where interventions 30 to 90 days ahead of a churn event are actually reliable rather than a coin flip dressed up in a dashboard.
What separates models that flag risk early from those that catch it too late
Forrester Research reported in 2025 that machine learning churn models reach 85-92% prediction accuracy on 90-day churn windows in B2B SaaS environments. Ninety days isn't an arbitrary number; it's roughly the operational runway a customer success team needs to change an outcome by running a re-engagement sequence, scheduling an executive business review, or getting a champion re-engaged before they've quietly checked out.
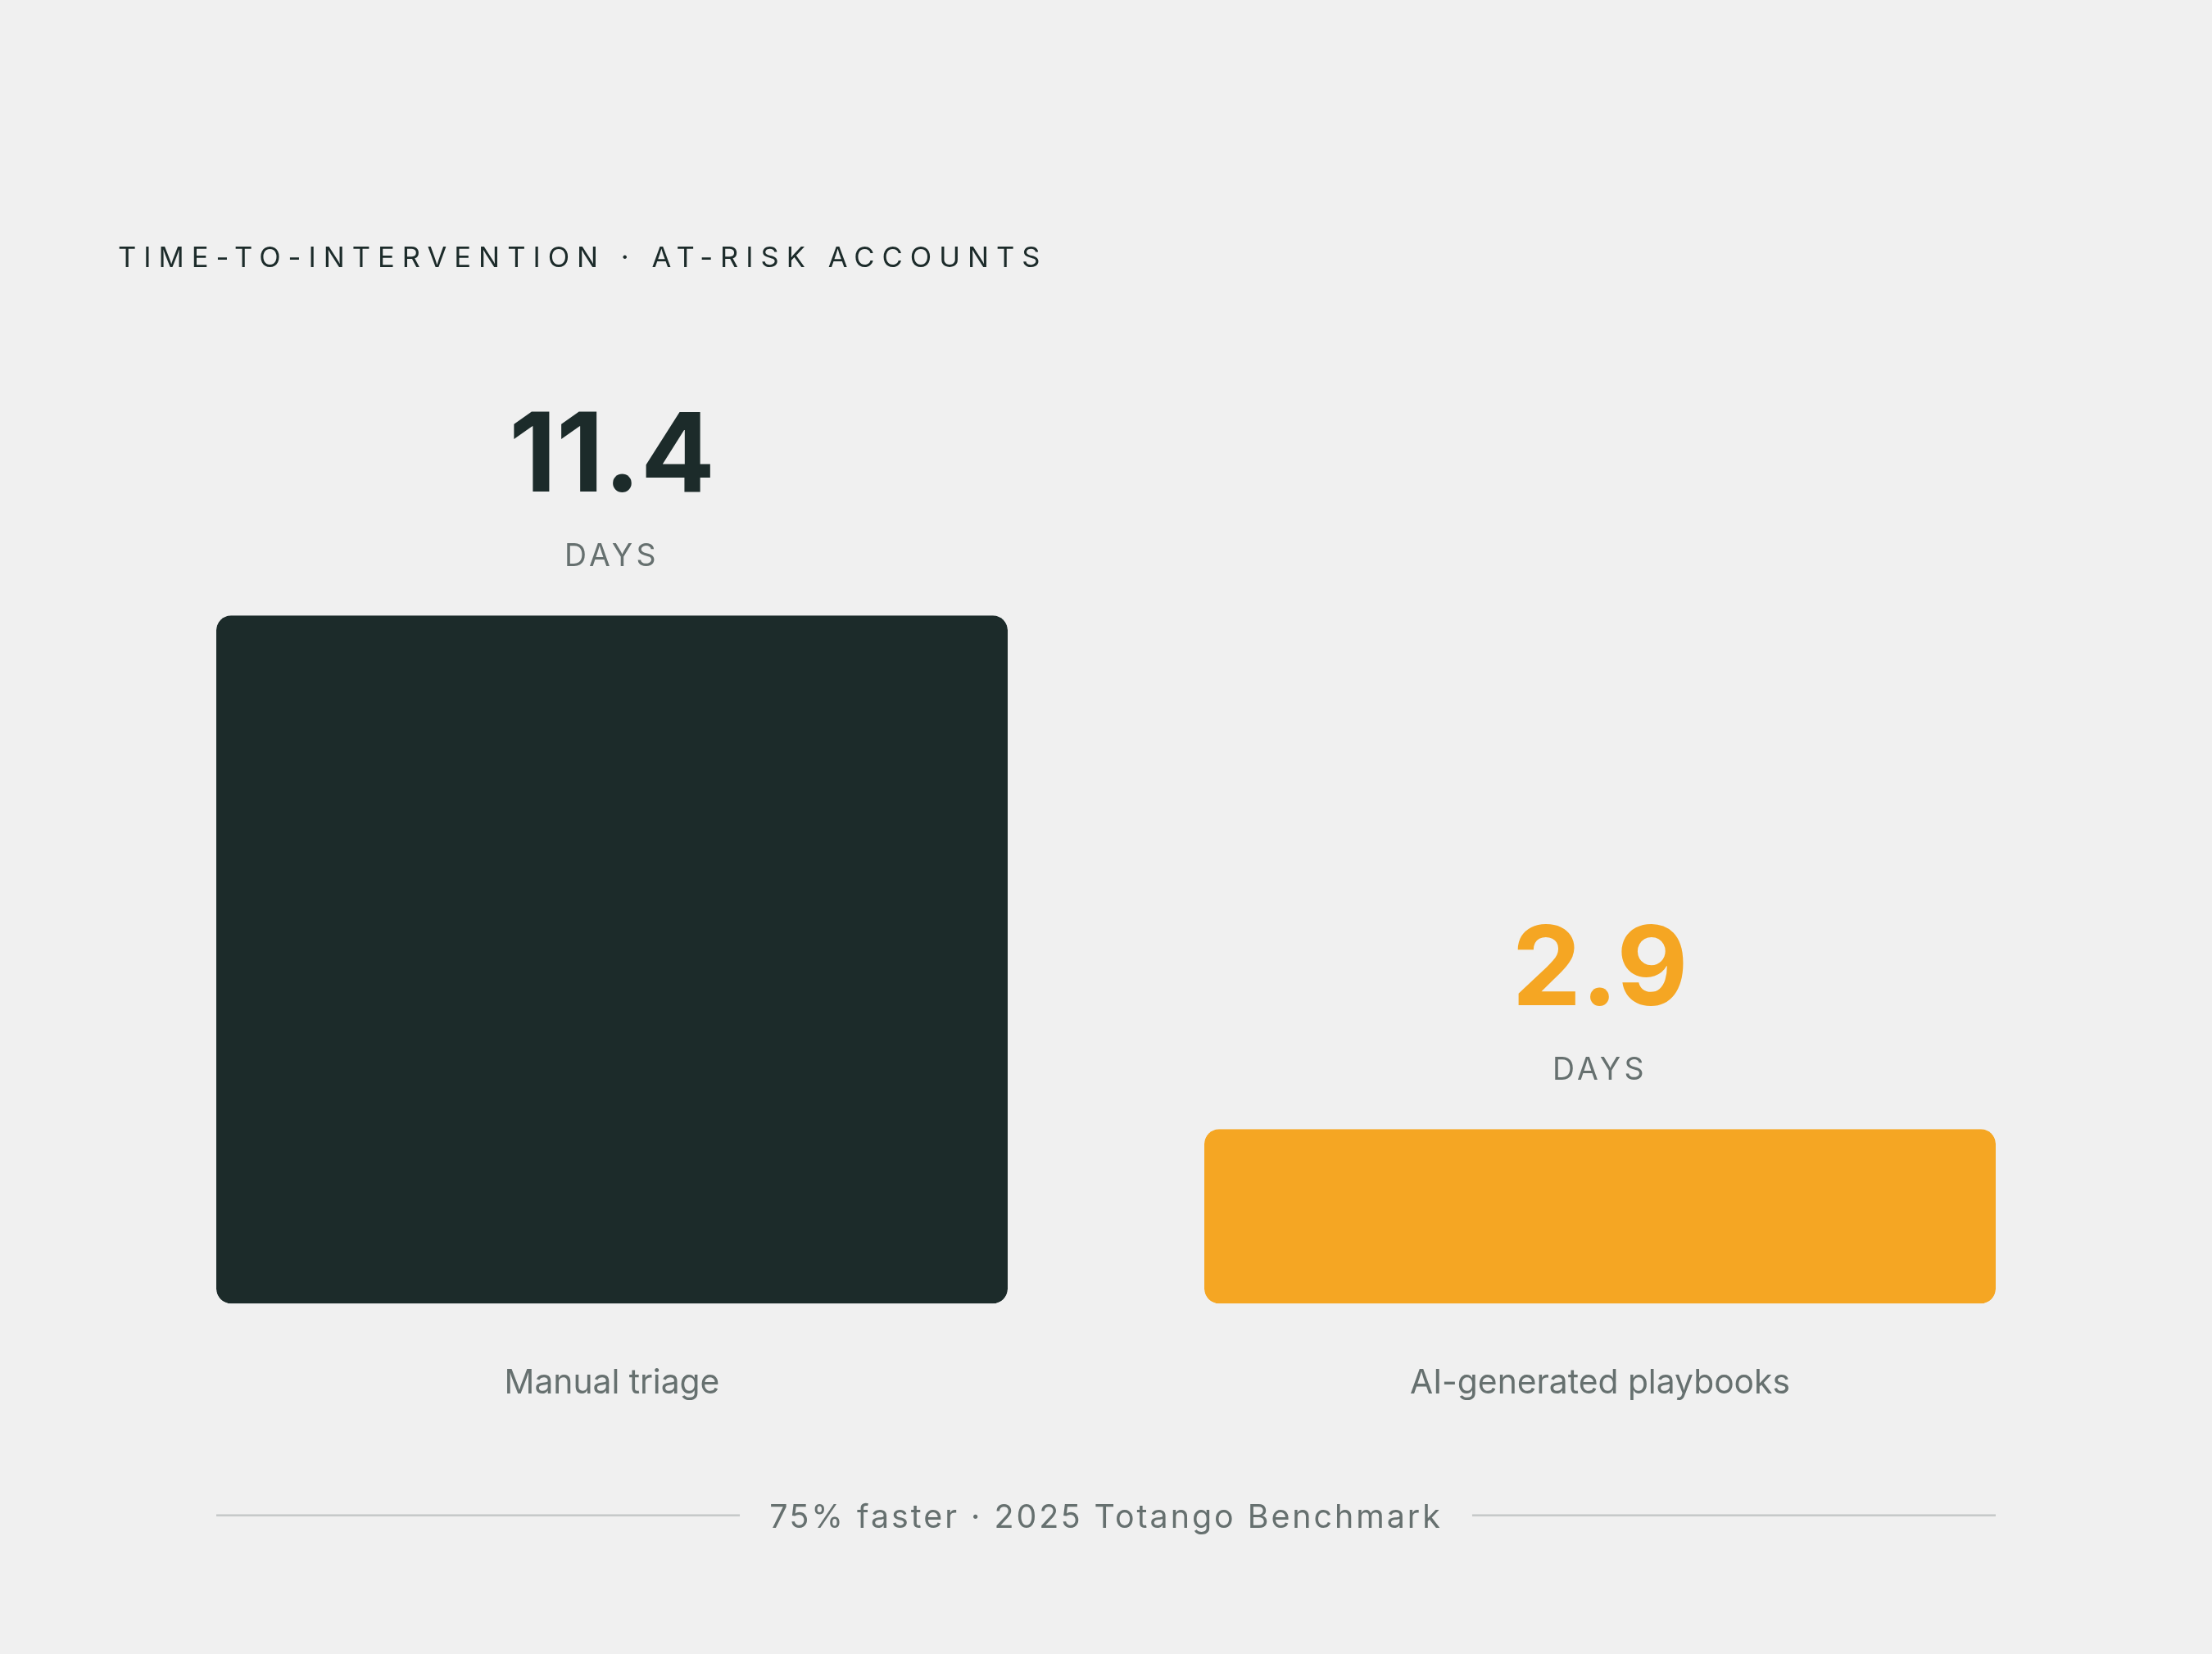
Speed of response matters as much as the model's foresight, maybe more. The Totango Customer Success Benchmark from 2025 found teams using AI-generated playbooks cut time-to-intervention for at-risk accounts from an average of 11.4 days down to 2.9 days. A model that flags risk 90 days out is only as good as a team's ability to act inside that window, and a two-week internal review process eats the lead time before anyone's picked up the phone.
A handful of failure modes show up again and again in models that catch risk too late to matter. Monthly aggregated usage data smooths over the week-to-week engagement drops that actually precede churn. Leaning on a single signal type, login data being the most common offender, misses the user who logs in religiously but never finishes a workflow. Account-level-only scoring averages out individual disengagement, often the earliest warning available. Ignoring champion movement means the team learns about the single most predictive relationship signal at the worst possible time, the renewal call itself.
The strongest models weight leading indicators, feature adoption trend, workflow abandonment rate, more heavily than lagging ones like support escalations or NPS scores. That reflects a deliberate architectural choice: building a model to warn early rather than one that simply confirms what's already happened.
None of this holds without a feedback loop. A model trained on churn patterns from a year ago drifts as the product changes and the user base shifts, and accuracy erodes quietly until someone notices predictions have stopped matching outcomes. Continuous retraining against recent churn events is how the highest-performing teams hold accuracy above 85% instead of watching it decay.
Weighting and combining signals inside a working feature set
Not every signal deserves equal weight, and feature adoption depth consistently beats login frequency as a predictor of long-term retention. Internalizing that point matters before building anything: the instinct to weight login activity heavily, simply because it's the easiest data to collect, works against accuracy rather than for it.
Four weighting principles do most of the work here. Recency matters: a usage drop in the last two weeks predicts more than one from three months ago. Velocity matters even more than any single data point, since a declining trend sustained over six weeks is far more reliable than one bad week that could just be a vacation or a busy sprint. Breadth counts the number of distinct features a user actually touches, not how many times they log in, because breadth is what drives the multi-feature retention effect described earlier. Depth measures whether a user completes workflows inside a feature, not merely whether they opened it once.
Combining product usage data with database state, what a user is actually provisioned to access, surfaces a gap usage data alone can't show: the space between capability and behavior. A user provisioned for five features who touches one is a materially different risk than a user provisioned for one feature who uses it every day. The first user is underutilizing a purchase; the second is fully realizing a smaller one. The model needs to treat those two cases differently, and most don't.
Building a composite health score means assigning weight to each signal category, engagement, adoption breadth, workflow completion, support pattern, relationship signals, then scoring accounts and users on a normalized scale. The accounts worth surfacing first are the ones where multiple signals are degrading at once; multi-signal deterioration predicts churn far more reliably than any single indicator moving on its own. Over-indexing on one metric is dangerous for exactly this reason. The support ticket U-curve makes the point cleanly: a rule system built purely on ticket volume flags the wrong customers on both ends of the curve, catching neither the disengaged nor the genuinely distressed with any precision.
Turning a churn probability score into a timed, personalized intervention
A probability score sitting in a dashboard is not a retention program on its own. It becomes one only when it triggers a specific action inside a specific delivery window. A lot of teams stop short of that step, treating the score itself as the deliverable instead of the trigger for one, and that's the gap between a model that looks good in a demo and one that actually saves revenue.
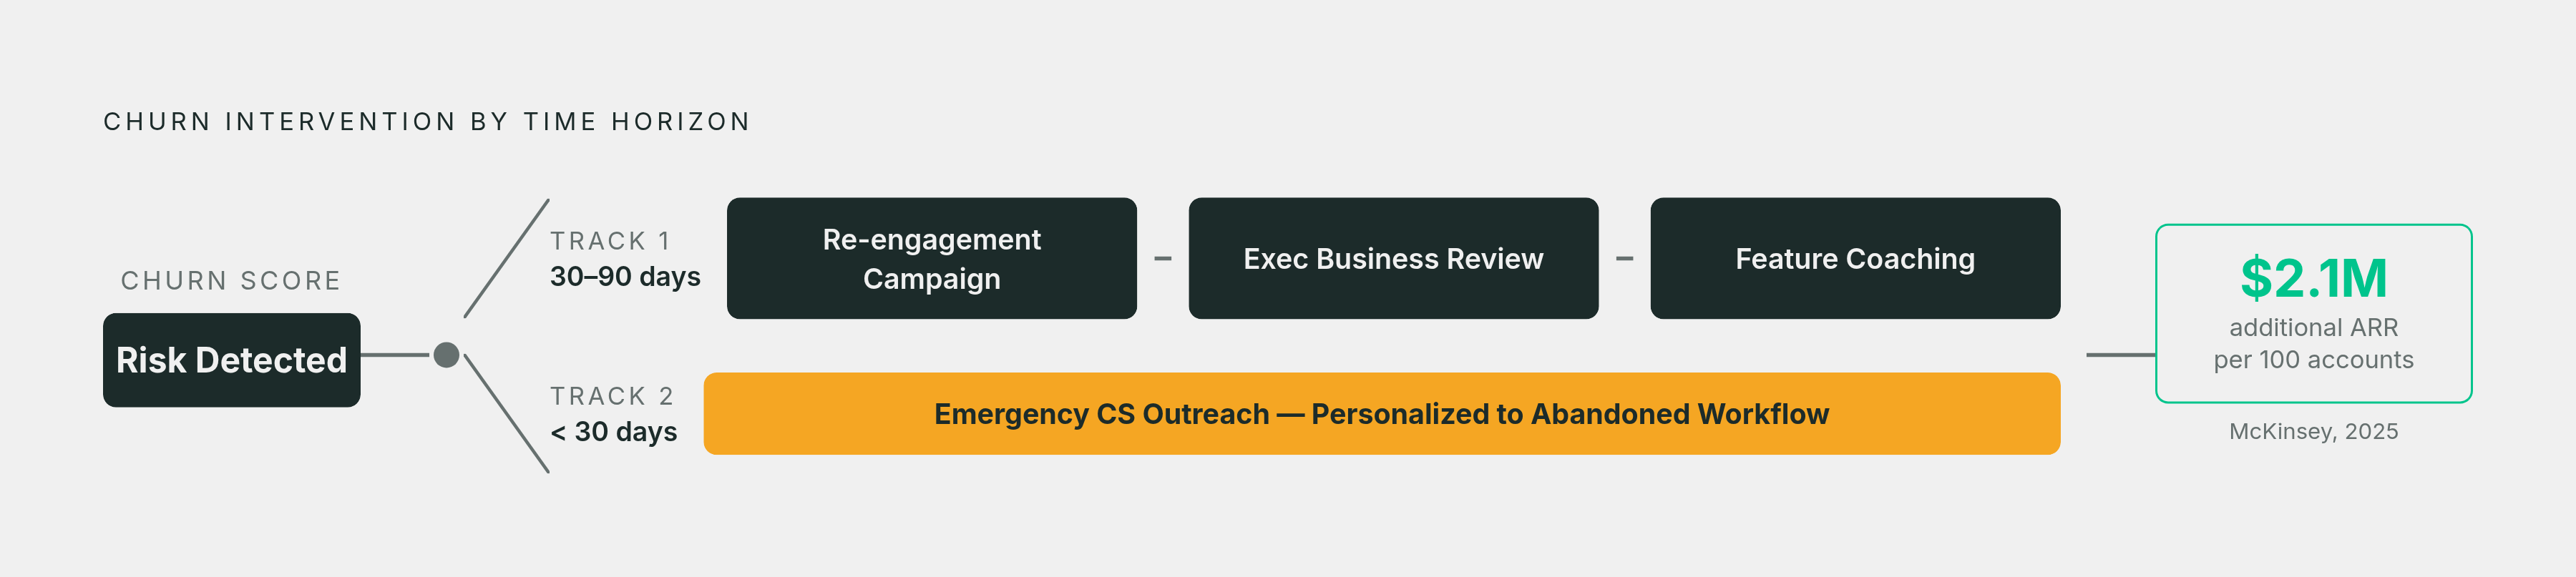
Timing should track the risk window. A 30 to 90-day prediction gives room to run structured re-engagement campaigns, schedule executive business reviews, or deploy a feature-coaching sequence before the customer has mentally checked out. A signal inside 30 days calls for something faster and more direct: emergency outreach from customer success, personalized around the specific behavior that tripped the flag.
Generic lifecycle emails fail here for a simple reason: they ignore what the individual user actually did or didn't do, which is precisely the gap that behavior-based retention platforms like Userlens, a YC-backed adoption agent for B2B SaaS teams, are built to close. A message that names the specific workflow someone abandoned, or the feature they were provisioned for but never opened, gets attention in a way a templated "we miss you" email rarely does. Effective intervention has three characteristics: it names the exact feature or workflow in question, it fires when the signal trips rather than on a scheduled batch send, and it proposes one concrete next step suited to the user's role and access level.
This is where AI adoption agents earn their place in the stack. Operating across every account at once, they find the next best action for each user and deliver personalized guidance without a human customer success rep having to manually triage hundreds of accounts one by one. McKinsey's 2025 research put a number on the outcome: businesses running AI-driven retention programs retained an average of $2.1 million in additional ARR per 100 accounts managed. That's a retention motion that scales with the customer base rather than with headcount, and headcount is always the more expensive of the two.
Product-led growth teams in particular cannot manually track which of thousands of users need which specific nudge. Shipping fast and reading behavior at the individual level are two different disciplines, and the second one has to move at the same pace as the first or it becomes decorative.
Measuring whether the intervention actually worked
Email open rates and click-through numbers are vanity metrics for a retention intervention, and any team reporting on them as a primary outcome is measuring the wrong layer of the funnel. Whether product behavior actually changed after the nudge went out is the only question that matters.
Three checks matter after any intervention fires. Did the flagged user go back and complete the workflow they'd abandoned? Did feature adoption breadth expand within the following two weeks? And did the account's churn probability score actually decline in the next scoring cycle, or did the intervention land and produce nothing measurable?
That outcome data has to flow back into the model itself, not just into a quarterly report. For accounts where intervention worked, the useful question is which signals responded fastest and which intervention type correlated with the behavior change. For accounts where it failed, the model needs an honest look at whether it underweighted a signal it should have caught, and whether the churn, once it happened, followed the timeline the model predicted or arrived earlier than expected.
Adoption campaigns should be built goal-first: define the specific behavior change target before the campaign launches, then measure against that target afterward, rather than against engagement proxies that feel good but don't tie back to retention. The gap between teams that do this and teams that don't is wide. Only around a third of product-led growth companies track activation at all, and fewer than a quarter report using product-qualified signals to prioritize which accounts get attention. Most teams running retention motions, then, are intervening without ever closing the loop, guessing at what worked instead of measuring it.
The teams compounding retention gains year over year share one habit: every intervention cycle feeds the next prediction. Churn prediction isn't a project with a finish line, but a system that has to keep learning from its own results, or it starts drifting the moment the product, the customer base, or the market moves past the data it was trained on.