Behavioral Cohort Analysis for Feature Adoption Diagnosis
Segment users by behavior and access to diagnose why features aren't actually adopted.
A feature adoption rate is an orientation metric, not a diagnostic one. The number tells you something happened, but it cannot tell you where the pattern broke. Most teams start their investigation with the rate itself, which is exactly the wrong starting point.
The problem begins in the denominator. If the denominator includes every user who logged in during the period, regardless of plan tier, role, or feature access, the rate systematically understates adoption among the cohort that actually matters. A user on a plan that does not include the feature drags the number down. So does a user whose job never requires the capability. The denominator decision has to come before the formula, yet it rarely does.
This produces a number that looks acceptable at the aggregate level while masking severe drop-off in a specific segment. New users in their first days behave differently from power users on a higher tier. The blended rate hides both patterns.
The same failure appears at the account level. An account can report healthy aggregate adoption even when a majority of licensed seats have never reached a value moment. Seat-level penetration is a more precise early-warning signal than a product-level rate. If fewer than half of licensed seats are actively engaged, an account carries roughly double the churn risk of a fully-adopted one.
The "active" definition compounds the error. A login is not active use. Active means completing at least one action that delivers value. If you lack that precision, the numerator is wrong before you even ask about the denominator. Deciding which users belong in the calculation at all is where most diagnostic work fails. Userlens reads each customer's current database state, which users have access, which roles matter, which plans are active, before measuring behavior, so the signal is not obscured by averaging across users who should never have been in the calculation.
What activation actually measures versus what adoption requires
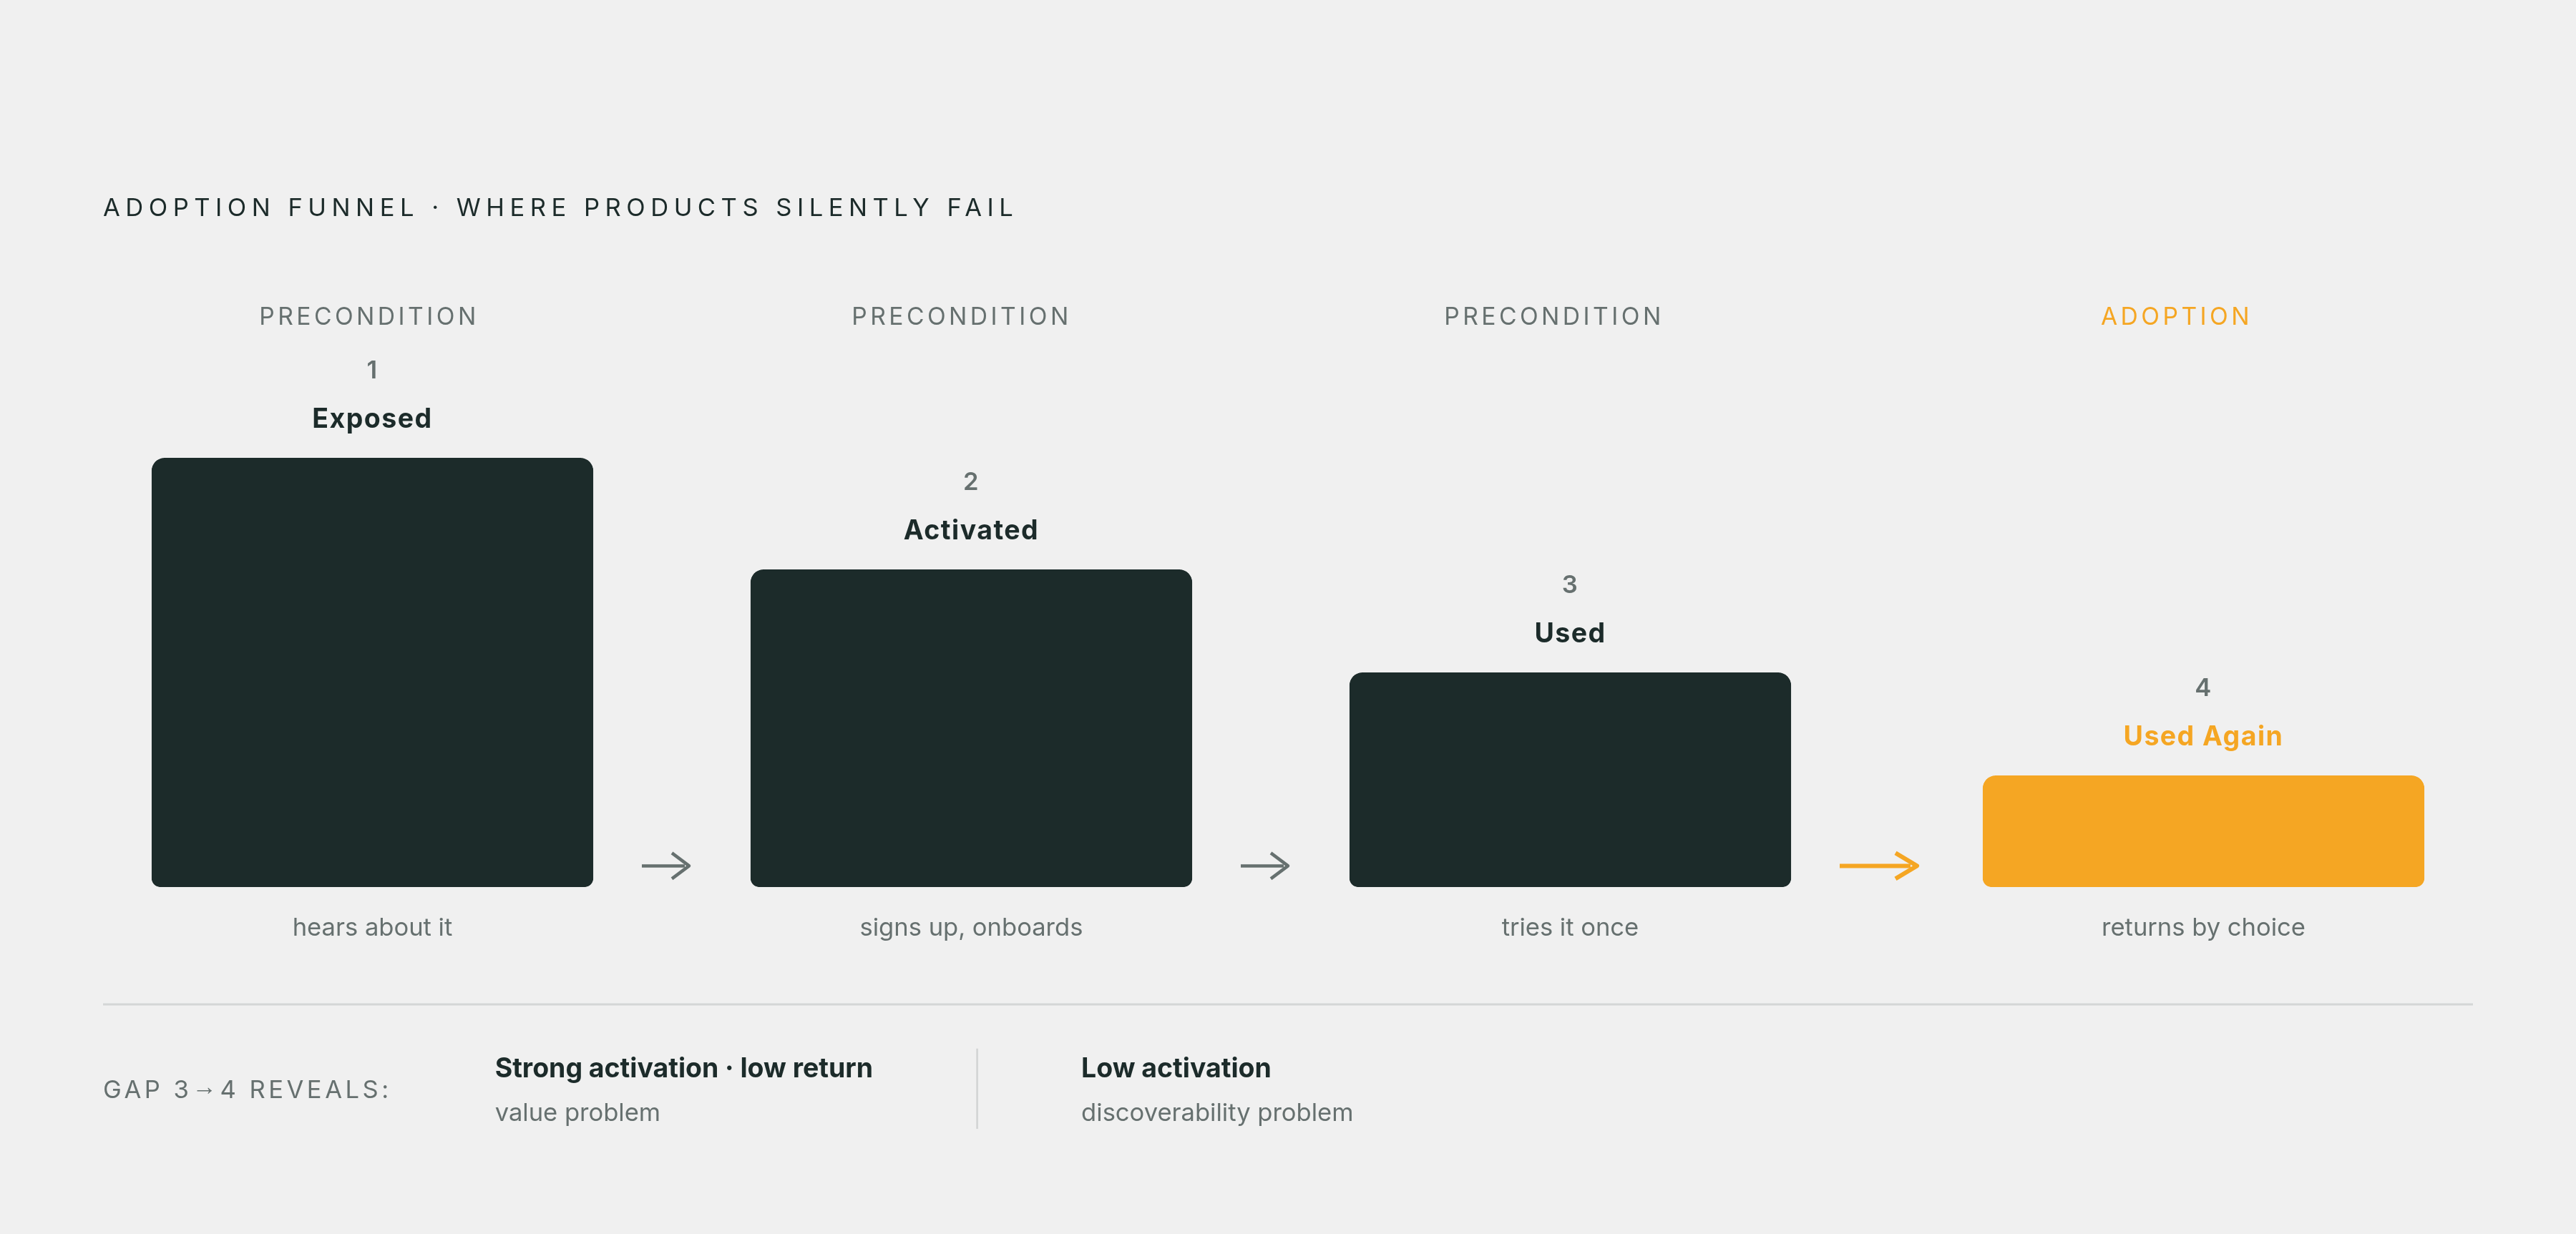
Activation and adoption are not the same stage of the funnel. Conflating them causes teams to run the wrong intervention on the wrong cohort. The adoption funnel has four stages: exposed, activated, used, used again. Only the fourth constitutes adoption. Everything before it is a precondition. Activation tells you a user experienced the feature once. Adoption tells you they returned to it independently because it has become part of how they work.
This difference carries an operational consequence. A feature with strong activation and low return usage has a value problem. A feature with low activation has a discoverability problem. Those diagnoses call for different interventions, and the wrong one wastes sprint capacity.
Activation rate, though useful at the top of the funnel, cannot serve as a proxy for adoption. Activation captures whether users reach the "aha moment." The more sophisticated growth teams track how quickly adoption happens after release, and whether it correlates with retention or expansion revenue. The question is not whether a user ever activated. The question is which users returned, when, and whether the return was self-directed. Time-to-second-use is the leading behavioral signal, yet most teams never isolate it because they lack a systematic way to identify which users returned independently and when. Userlens investigates each person's usage sequence, when they first acted, when they returned, whether that return was prompted or self-directed, so the gap between activation and genuine adoption becomes visible enough to act on.
How to segment by behavior instead of acquisition date
Traditional cohort analysis asks how January signups behave versus February signups. Behavioral cohort analysis asks how users who activated a core feature in the first week behave versus those who did not. The question is about usage sequences, not calendar segments.
Start by segmenting the denominator before calculating any rate. Define which users had access to the feature, completed the prerequisite workflow, and occupy the role for whom the feature is relevant. Then measure adoption within that defined cohort.
Role is a structural B2B complication. The features that drive retention for an account administrator are different from the ones that matter for an end user in the same account. A single cohort that ignores role collapses this signal. A PM reviewing session data sees active users. The renewal conversation surfaces a product embedded in one person's workflow and nowhere else in the organization.
Multi-user accounts require a separate account-level cohort view. The champion activates while the rest of the team does not. Individual-level cohort data looks healthy, but account-level feature penetration is a fraction of what it could be. Behavioral segmentation gives you actionable signal only when you know each person's role and account context. Platform analytics alone cannot tell you if a feature is embedded across a multi-user account or confined to a single champion. Userlens combines backend state with usage behavior to identify which roles are adopting and which seats remain untouched, so role-based and account-level cohorts become a basis for targeted intervention rather than a sorting problem for the data team.
An expanding product surface creates a re-adoption problem. A user who fully adopted the product at signup has not adopted capabilities shipped since then. Their behavioral cohort membership effectively resets at each release, and a date-based cohort does not capture that.
The practical construction rule has three parts. Define the cohort by feature access eligibility, role or job-to-be-done, and completion of the prerequisite behavior that makes the feature relevant. Then track the usage sequence from that starting point. This gives you a cohort whose behavior you can compare against an expected sequence, not against a calendar.
Reading the gap between expected and actual usage sequences
The signal is not in the adoption rate itself but in the shape of the drop-off. Where in the usage sequence the cohort falls away tells you whether the problem is discoverability, value, or workflow fit. Two root causes demand two opposite interventions. With a discoverability problem, users who meet the feature in support or guided tours are surprised. They did not know the capability existed despite months of product use. With a value problem, users found the feature, used it once, and did not return. Running the wrong intervention does not just fail to move the metric. It wastes the sprint capacity needed to access engineering.
The funnel diagnostic separates the two. Low exposure-to-activation rates point to a discoverability problem. If activation is strong but return usage is low, the problem is value. Measure both rates within the cohort before forming a hypothesis.
If a surface relies on menu navigation or static placement, it fails the discoverability test. Contextual feature surfacing based on user actions and workflow states outperforms static placement for feature discovery. Crossbeam saw a 3x improvement in click-through rate after it switched from role-based announcements to behavioral routing. The mechanism is straightforward: surface announcements to users whose behavior signals readiness for the next capability, not to all active users at launch.
The retention curve comparison is the value test. Plot the retention curve of users who adopted the feature against those who did not. If the adopter cohort retains at a materially higher rate, the feature drives business value. If the curves are similar, the feature may be non-essential. This goes beyond vanity metrics about feature usage, because it shows which features actually drive business outcomes and which consume engineering resources without moving key metrics.
Account-level breadth matters too. If a feature reports strong aggregate adoption but stays invisible to decision-makers within the account, it is a retention risk that seat-based data catches only at renewal. Integration depth is a related proxy. Accounts with deeper integration adoption show meaningfully higher retention.
The scope of the underlying problem is large. A significant majority of product features see low to no regular usage. Most cohort analyses will surface features whose drop-off is structural, not incidental. That requires a hypothesis about root cause before any intervention is designed.
Why a descriptive dashboard cannot produce this diagnosis
Descriptive analytics surfaces what happened. Behavioral cohort analysis asks why it happened and where specifically. That difference is operational, not cosmetic.
The descriptive approach enables teams to see adoption rates, churn rates by cohort, and support volume patterns. It is retrospective. It explains past performance, but it does not predict future behavior or recommend an action. That is fine for a board meeting. It is not enough to change what happens next.
The AI contamination problem compounds the limitation. AI agents now trigger product events, complete tasks, and generate API calls that show up in telemetry alongside human activity. Mixing agent and human signals creates false positives on health scores. An account can look highly engaged because its automation layer is active while its human users have quietly disengaged. A 2026 industry projection estimates that approximately 40% of enterprise applications will carry meaningful AI agent activity by end of year. Separating these signals is now a prerequisite for meaningful cohort analysis, not an optional enhancement.
Lifecycle marketing tools and email sequences fail the same test. A re-engagement message built before the user's behavior changed is a campaign artifact, not a response to current behavioral state. It prescribes to a persona assumption rather than to the actual sequence the individual user has completed or skipped.
The category distinction is clear. CS analytics and lifecycle marketing tools hand you a chart or merge a first name into a template. A prescriptive approach hands the customer the next thing to do, grounded in what they have actually done in the product. The output is a specific, actionable recommendation, not a forecast or a dashboard.
Signal latency is the strongest objection to prescriptive systems. A prescriptive system built on stale or incomplete data prescribes incorrectly and erodes trust faster than a dashboard ever would. The quality of the underlying behavioral signal, not the sophistication of the intervention layer, is the first constraint to address.
Translating a behavioral cohort signal into an intervention for the right person at the right moment
The gap between expected and actual usage sequences is only useful if it triggers an intervention tailored to what that specific person has and has not done. A broadcast to everyone in the cohort is not an intervention. It is noise with a merge field.
Being in a cohort does not automatically justify a message. A user whose behavioral signal is ambiguous or whose evidence of need is weak should not receive an intervention. Skipping when evidence is weak is part of the method, not a failure of it.
The intervention should match the diagnosis. A discoverability gap calls for contextual feature surfacing at the moment the user's workflow makes the feature relevant. A value gap calls for guidance grounded in what the user actually did on their first interaction and what the next useful step is. Behavioral triggers outperform static placement and scheduled sequences because they respond to the current state of the user's workflow rather than a calendar assumption. Behavioral announcement routing surfaces a capability to users whose behavior signals readiness, not to all active users at launch date. The message content must be grounded in the user's actual product state: what they have done, what they have not done, and what the logical next action is. Personalization that recites activity back to the user without directing them toward a useful next step is surveillance-flavored, not helpful.
To measure whether the intervention worked, you compare the behavioral cohort before and after. Did the user complete the usage sequence they had previously stalled at? Did the cohort's retention curve improve? Opens and clicks do not answer either question. The outcome measure is repeated successful use of the feature, not engagement with the message.
The scale argument is the same logic a founder applies manually to their first handful of customers: reading each person's actual usage state and deciding what they need. That can now be applied systematically across thousands of users when the signal, current database state plus behavioral history, is connected to the intervention layer. The cost that previously made personal-at-scale impossible is gone. An adoption agent that works within an approved campaign goal, investigates each eligible person independently, skips when evidence is weak, and measures whether product behavior changed is the practical form that prescription takes at scale.
Jimo's framework illustrates the stage-specific approach. Feature Discovery, Depth Adoption, Team-Level Adoption, and Sustained Adoption each fail in a distinct way, so each needs a distinct strategy. A single intervention pattern applied across all four stages will solve at most one of them.
For RevOps and data teams, the intervention logic should be auditable. The behavioral signal that triggered a message, the criterion that made the person eligible, and the outcome measure should all be inspectable without a new instrumentation layer, working from the database state and product analytics the team already has. The outcome the method produces is a cohort whose adoption curve moved, not a dashboard that reports it stayed flat.